skip to main
|
skip to sidebar
Map Catalog
Friday, April 23, 2010
Index value plot
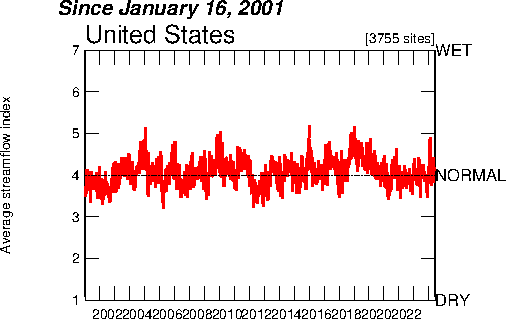
This plot shows the average streamflow index from 2001 until present day. The graph is divided into dry, normal and wet. The theme of this plot is the amount of streamflow over a given period of time.
photo link
No comments:
Post a Comment
Newer Post
Older Post
Home
Subscribe to:
Post Comments (Atom)
Followers
Blog Archive
▼
2010
(53)
▼
April
(53)
Mental Map
Planimetric Map
Topographic Map
Thematic Map
Cadastral Map
PLSS Map
Hypsometric Map
Propaganda Map
Dot Distribution Map
Cloropleth Map
Proportional Circle Map
Isoline Map
Flow Map
Cartogram
Statistical Map
Cartographic Animation
Infrared Aerial Photo
Black and White Aerial
Doppler Radar
LIDAR
Isobar Map
Isotach Map
Isohyet Map
Isopach Map
Isopleth Map
Digital Raster Graphics (DRG)
Digital Line Graph (DLG)
DEM map
Digital Orthophoto Quarter Quadrangles (DOQQ)
Bivariate Cloropleth Map
Continuously variable proportional circle map
Univariate Choropleth Map
Standardized choropleth maps
Unstandardized Choropleth map
Nominal area choropleth map
Bilateral graph
Lorenz Curve
Index value plot
Scatterplot
population profile
Climograph
Windrose
Triangular plot
Parallel coordinate graph
Histogram
Box plot
stem and leaf plot
Similarity Matrix
Correlation matrix
Star Plots
Range graded proportional circle map
Classed Choropleth map
Unclassed Choropleth map
About Me
Kevin Asa Noack
View my complete profile
 This plot shows the average streamflow index from 2001 until present day. The graph is divided into dry, normal and wet. The theme of this plot is the amount of streamflow over a given period of time.
No comments:
Post a Comment