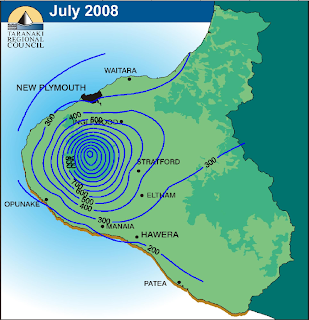
This map joins areas of equal rainfall by blue, contour bands, and also shows basic land elevations in the area. Specifically, this map illustrates New Zealand's average rainfall for July of 2008. This kind of map can be useful to see which areas are receiving the most rain over a certain time. The trend in this map is showing where the rain is falling.

No comments:
Post a Comment